
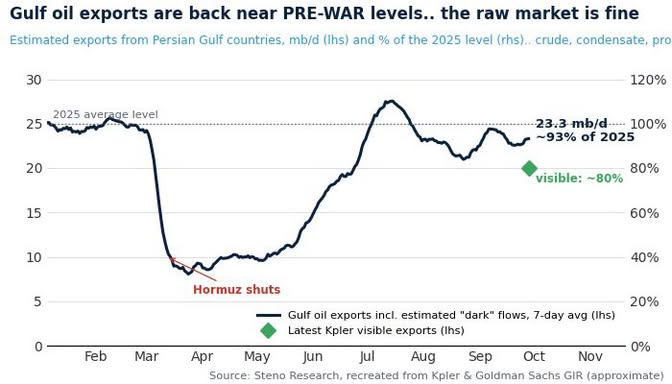
WHY DOES THIS CHART MATTER FOR OIL? Because despite all the disruption around the Persian Gulf and Hormuz, Gulf oil exports have recovered to nearly pre-war levels. 🛢️ Current estimated exports: 23.3 mb/d 📊 That's roughly 93% of the 2025 average 👀 Visible Kpler exports: 80% Look at the chart: When Hormuz shut, exports collapsed from roughly 25 mb/d to below 10 mb/d. But the recovery has been remarkable. WHY? The physical oil market appears to have adapted much faster than many expected, with export flows—including estimated “dark” flows—returning close to normal. That's important because oil prices ultimately care about actual barrels reaching the market, not just geopolitical headlines. WAR RISK ↑ does not necessarily mean OIL SUPPLY ↓ If Gulf exports are already back to 93% of normal, the market may have considerably more physical supply than the headlines suggest. 🟢 Potentially bullish: refiners, shipping volumes, global economic activity 🔴 Potentially bearish: crude oil prices if the geopolitical risk premium continues to unwind The headline says disruption. The barrels say recovery. Watch the physical flows. 🛢️ $CL F $USO $XLE $VLO $MPC $PBF #Oil #Energy #Hormuz #CrudeOil #Investing 📷
published
WHY DOES THIS CHART MATTER FOR OIL? Because despite all the disruption around the Persian Gulf and Hormuz, Gulf oil exports have recovered to nearly pre-war levels. 🛢️ Current estimated exports: 23.3 mb/d 📊 That's roughly 93% of the 2025 average 👀 Visible Kple
$CL$USO$XLE$VLO$MPC$PBF
Open the original public source →
Latest documented BWB result
$NVDA market result
Exit $NVDA with $3 profit per share
Historical results are not a promise of future performance. Trading involves substantial risk.This public post is a timestamped information archive, not personalized financial advice. Alerts can change as markets move. Join Billy's private group for the complete daily stream and follow-through.